
There’s a new tool in town.
The Bay Area Greenprint is designed to help transportation agencies, water districts, and the conservation community in their work. It is an online mapping tool and data cruncher that measures natural and agricultural resources, and quantifies the importance of those resources in our lives. Planners and policymakers can use this information to better understand the costs and benefits of possible land use decisions.
A team of conservation, data, and mapping experts from The Nature Conservancy, Greenbelt Alliance, American Farmland Trust, the Bay Area Open Space Council, and GreenInfo Network designed and developed the Bay Area Greenprint. The team launched the tool in June 2017 after working on it for two years with science and method advisors from several other regional organizations.
The need for such a tool is evident for those who work in land conservation, said Tom Robinson, director of conservation, science, and innovation at the Bay Area Open Space Council and co-lead on this project. Prior to working with the Open Space Council, Robinson worked for years at the Sonoma County Agricultural Preservation and Open Space District. He knows how difficult it is to get data into a communicable shape necessary to make decisions, obtain permits, and submit in grant proposals.
“There is a giant gap between getting data and pulling it into a form at the desktop level,” said Robinson. “The amount of information that [planners and conservation managers] are supposed to be conversant in expands every year, and Greenprint is designed to help those folks get quick access to interpreted data for their world.”
The Nature Conservancy’s Liz O’Donoghue served as the project lead. “In the Bay Area, we have a wealth of natural and agricultural resources and a wealth of information about those resources,” she said. “We wanted to find a way to accumulate data and present it to planners in a straightforward and easy way so that they can make smart planning decisions grounded in science and the latest, up-to-date data.”
The Greenprint team’s first step was to identify potential users and ask them how the tool might make their lives easier. The team then identified natural and agricultural values and benefits, and funneled them down into simplified terms. They matched those with existing data, and worked with the target users on scenarios for useful applications.
One important goal of the project was to integrate the topic of natural resources into planning processes earlier. For example, transportation agencies design upgrades like lane additions or new interchanges based on need. The environmental review, however, comes late in the process and can introduce challenges — such as an endangered species hotspot or a flood zone — after plans are well underway. Greenprint reveals such complications ahead of time by providing a quick snapshot of the area in question. Planners can identify a proposed project area and learn early on if they need to consider prime farmland, an important wildlife corridor, or a groundwater recharge zone.
For those who navigate maps and data daily, using the Bay Area Greenprint tool for the first time may come easy. For those who don’t, it may not feel so intuitive. “Like any new technology, you need to give yourself time to understand it,” said O’Donoghue. “Then it becomes second nature.”
Average Bay Area residents who learn how to use Greenprint may find themselves better prepared to participate in the planning of their own communities. For example, a supporter of urban limit lines could create a map and bring it to a city council meeting as a visual aid for persuading elected officials. “Greenprint empowers activists,” said Carrie Schloss, a data scientist at The Nature Conservancy. “It democratizes the process when an activist can bring talking points, statistics, and maps to community meetings.”
The Bay Area Greenprint does not yet have long-term funding or a permanent home, but the organizations that launched it are committed to seeing it solidly implemented in the Bay Area. For the next three years, their focus is on outreach, education, and training.
Aleta George covers open space for the Monitor.
Matt Freeman, assistant general manager of the Santa Clara Valley Open Space Authority, is a project advisor for Bay Area Greenprint. He called the tool “a great starting place to get a quick, high-level understanding of open space values and planning issues,” and walked the Monitor through an example of how to use it to analyze the Coyote Valley. This priority natural landscape provides the last remaining undeveloped linkages between the Santa Cruz Mountains and the Diablo Range. These natural lanes are used by wildlife such as mountain lions and tule elk to migrate, find mates, and survive. The corridor between the mountainous wilds is vital for species to adapt to climate change and maintain genetic diversity. Here are step-by-step instructions given by Freeman for how to create a map to show the linkages:
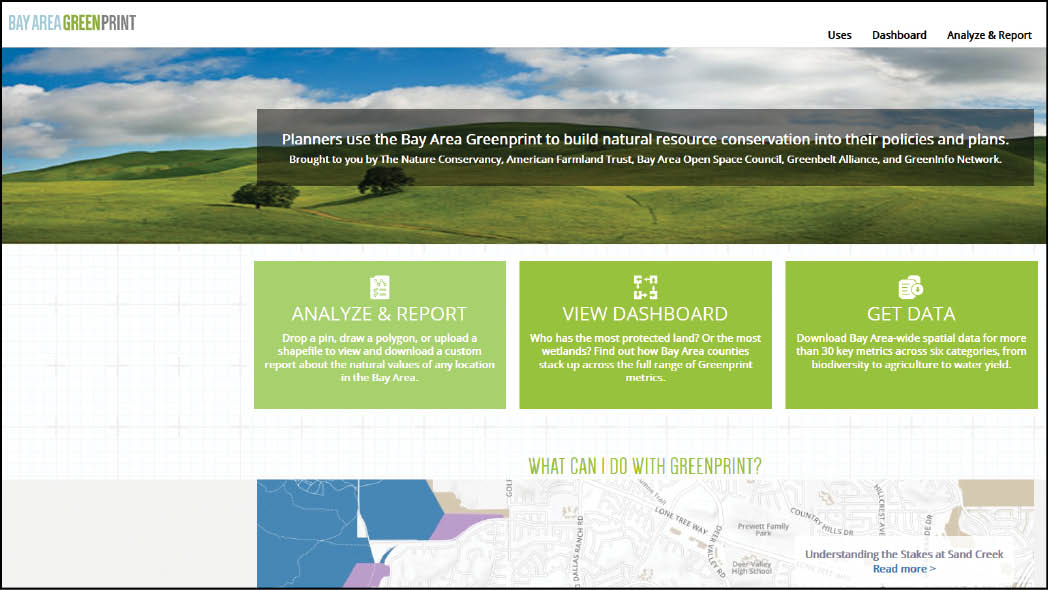
1) Go to bayareagreenprint.org and click “Analyze & Report.” A map will appear; zoom in by clicking the “+” sign; click-and-hold the map to drag it around so that Morgan Hill is in the frame.
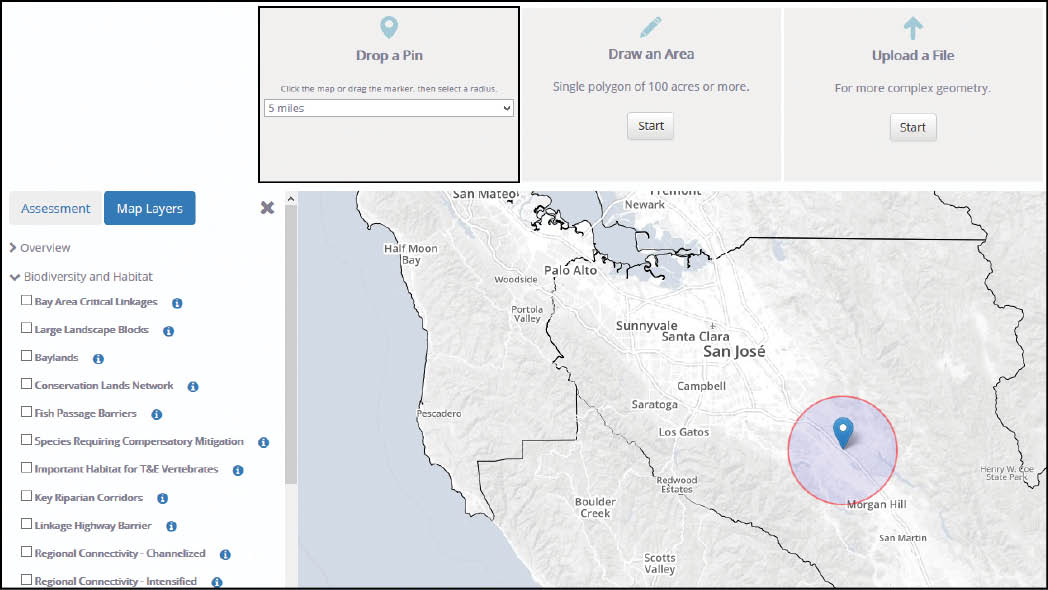
2) Click “Start” in the “Drop a Pin” box and select a 5-mile radius in the drop-down menu. Click-and-hold the pin to drag it onto US 101 between San José and Morgan Hill.

3) Click “Map Layers” in the box to the left of the map (next to the “Assessment” box). Click on “Biodiversity and Habitat” and select “Bay Area Critical Linkages” from the drop-down menu.
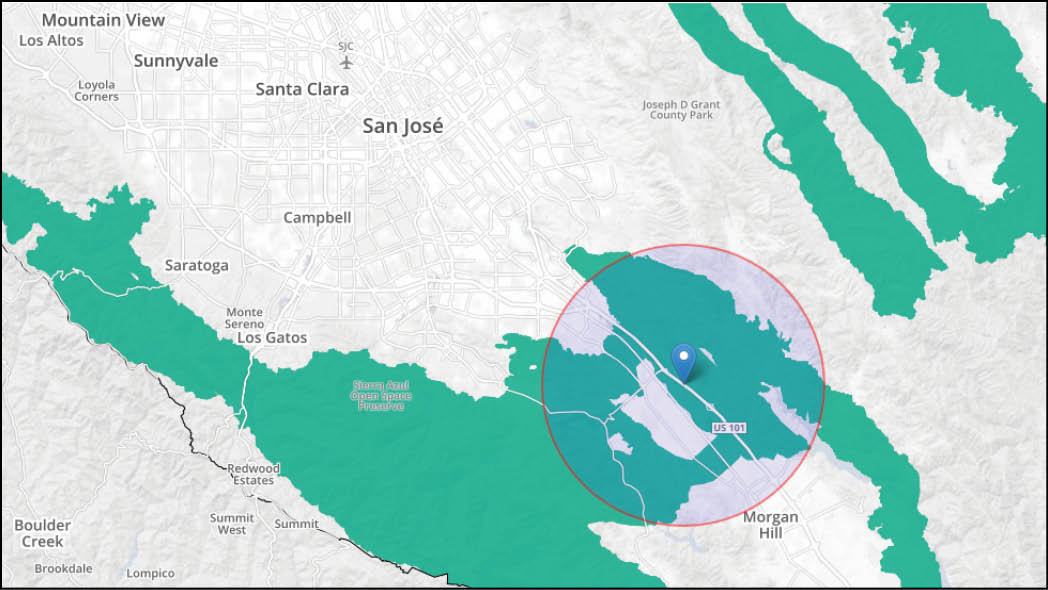
4) The resulting map shows the wildlife corridors that connect the mountain ranges in the Coyote Valley, bringing the concept of linkages to life with a visual representation.
Experiment with the map to learn more about what Bay Area Greenprint can do. Try viewing new map layers, like “Agriculture,” where clicking “Agricultural Land” reveals five types of farmland. Instead of using a pin, select other top boxes to draw an area, upload a GIS shapefile, or choose a predefined area such as a city, county, or watershed. Click on “Get a Report” for detailed data about the selected area.